
Executive Summary
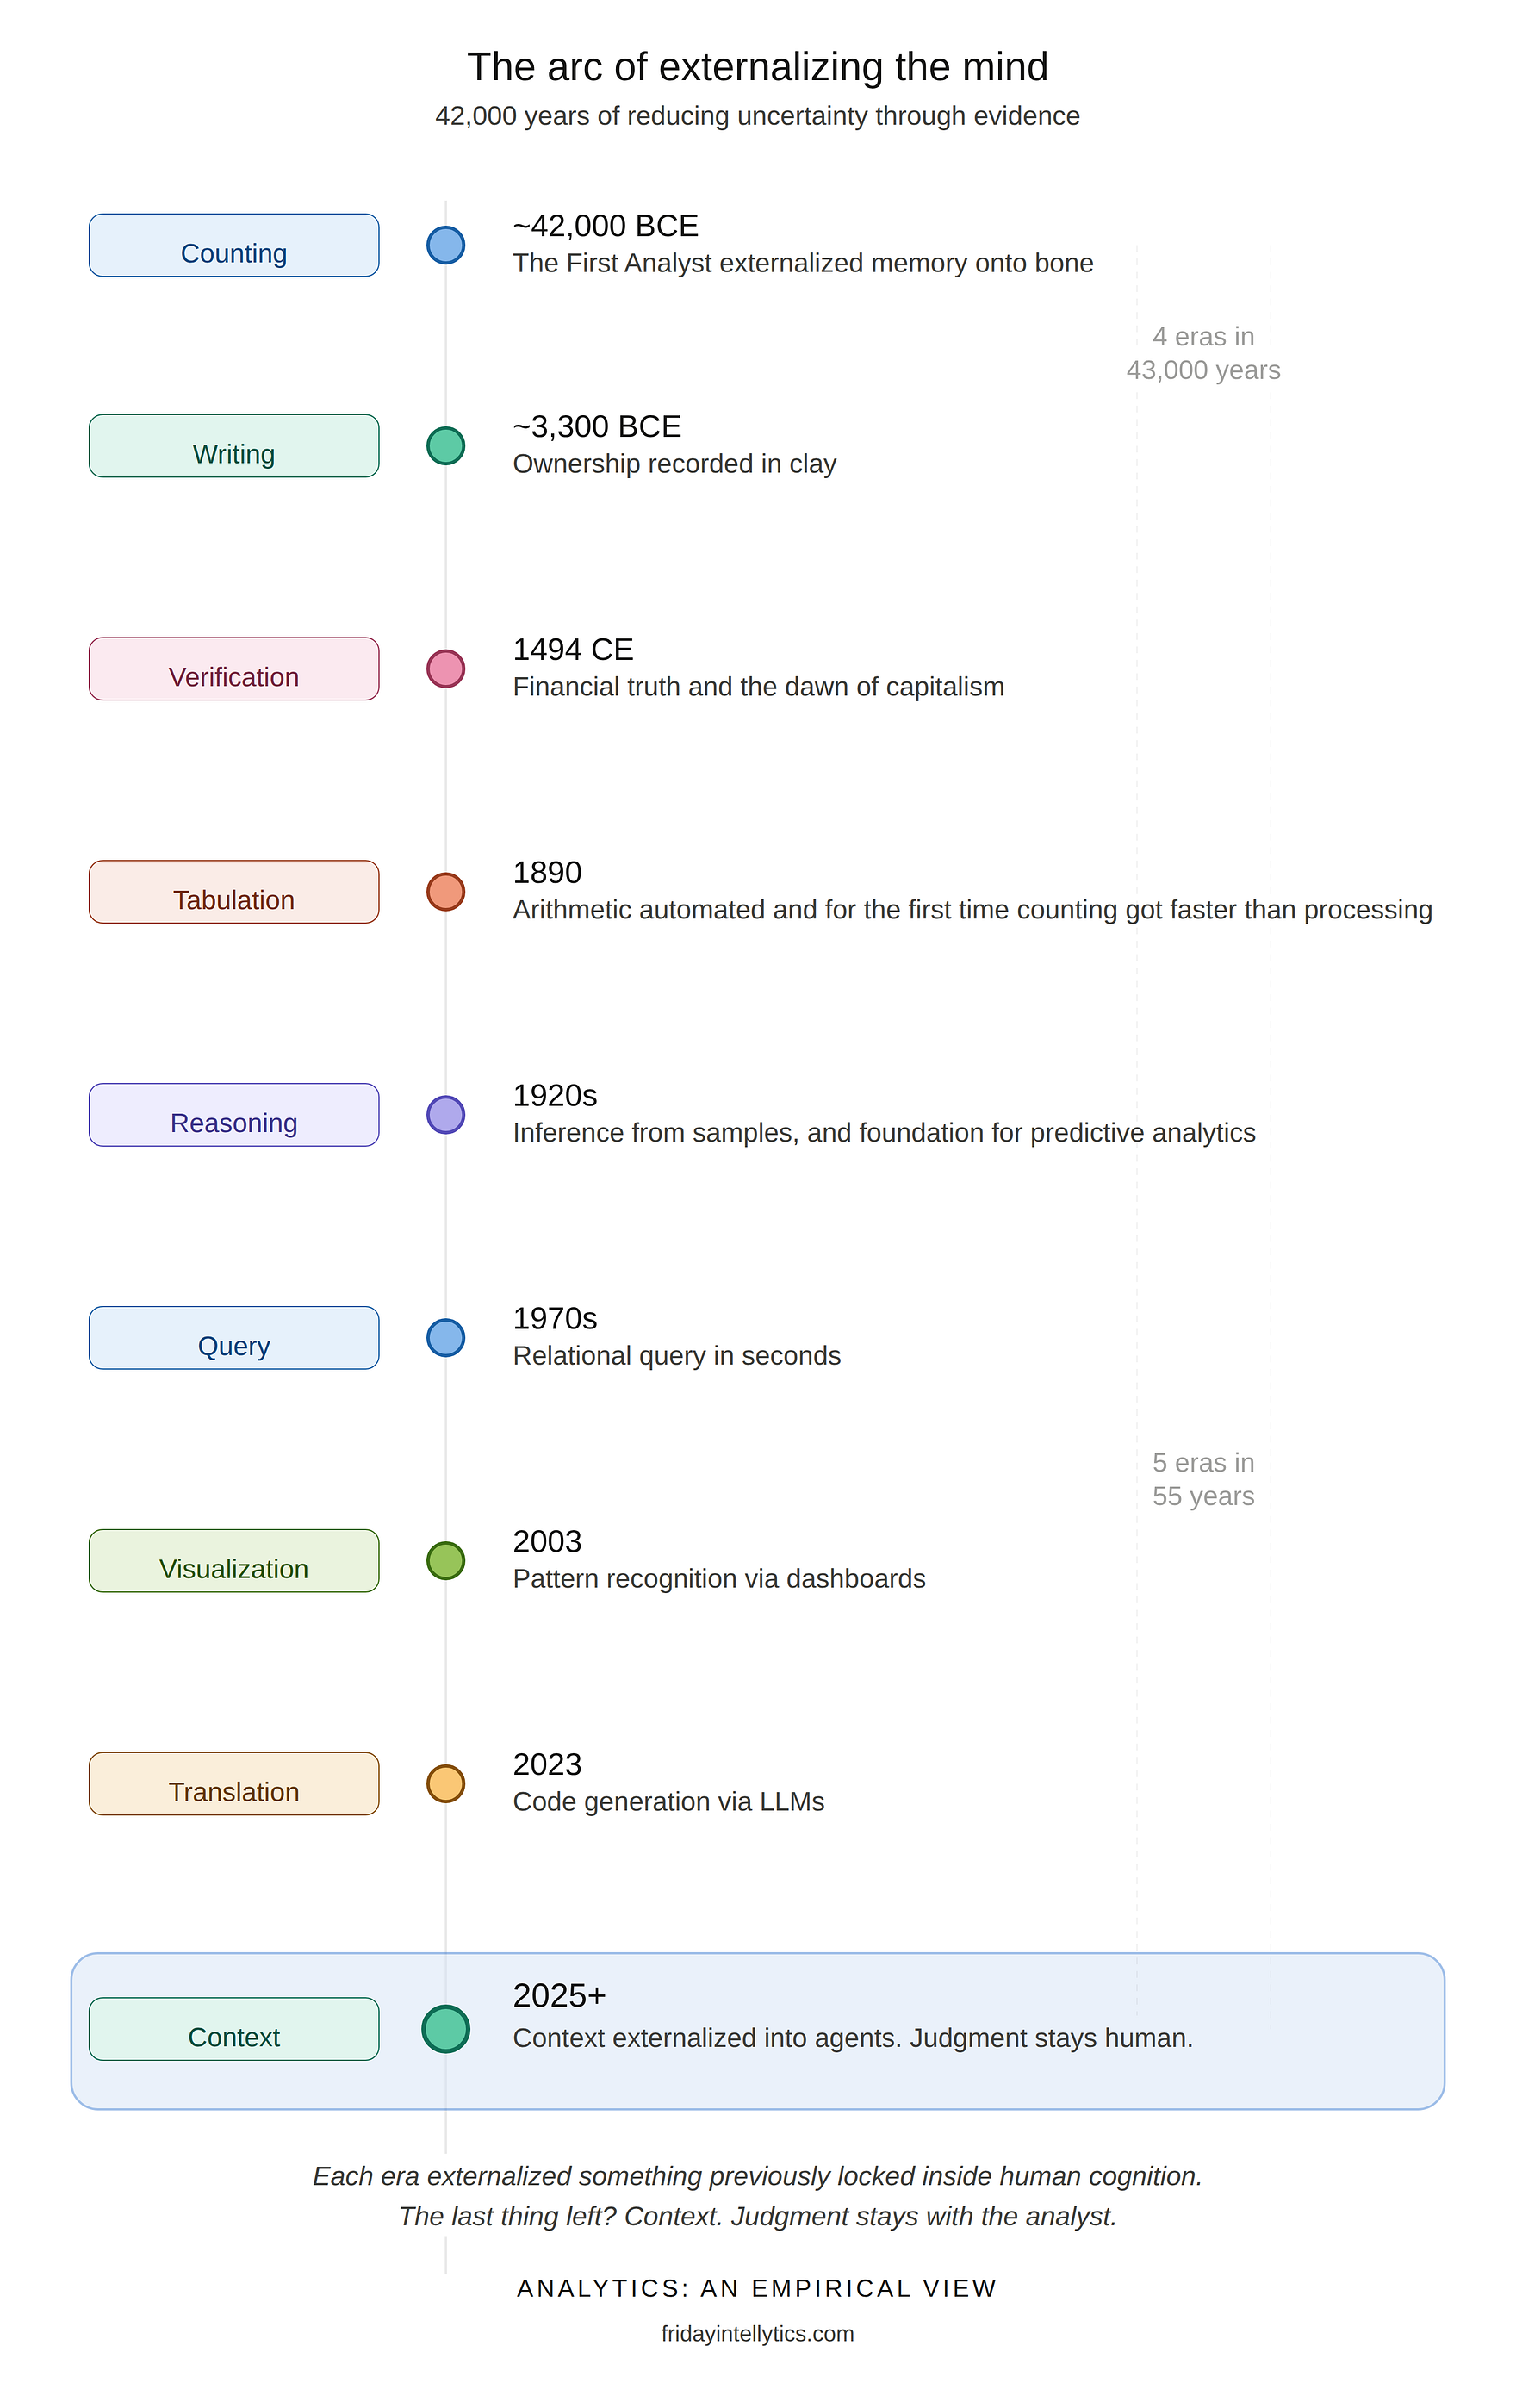
Analytics is fundamentally a human story rather than a technology story. The piece traces 42,000 years of externalizing memory and automating reason, from tally marks on a baboon bone to AI agents navigating enterprise data autonomously.
Every civilization that rose found better ways to count, record, and decide. The Sumerians invented writing for accounting. Pacioli’s double-entry bookkeeping became capitalism’s operating system. Hollerith’s punch cards compressed the U.S. census from 8 years to 3 and spawned IBM. Tableau made databases visual. LLMs made them conversational.
The agentic turn now promises to externalize the final cognitive bottleneck: context — organizational memory, institutional knowledge, and the analyst’s hard-won understanding of what terms actually mean at a specific company. Storage, compute, and visualization are no longer constraints. Cognition is. The gap between 181 zettabytes generated and decisions made from them has never been wider.
Judgment, however, remains human. It always has.
I. The first analyst had fur and a bone
Roughly 42,000 years ago in the Lebombo Mountains on the South Africa–Eswatini border, a human carved 29 notches into a baboon fibula.
That was the first analytics project.
No Tableau. No Python. No stakeholder alignment meeting. Just a three-inch bone and an urgent question that has powered every subsequent civilization: How many?
The Lebombo bone — humanity’s earliest known tally stick — is often interpreted as a lunar phase counter. Twenty-nine notches. One lunar cycle. If this interpretation holds, the first data analyst may have been tracking the moon’s cycle. The first “dashboard,” in other words, was carved from the leg of a selenophile primate.

Twenty thousand years later and a continent away, near the Nile’s headwaters, someone carved 168 etchings across three columns on another baboon fibula — the Ishango bone. Researchers have debated its purpose for decades. Some see prime numbers. Others see a six-month lunar calendar. A few see nothing more than a good grip for a quartz-tipped engraving tool. But one thing is undisputed: the marks are not random. They are grouped, sequenced, and deliberate.
The human brain was doing analytics long before it had a word for it. It was externalizing memory. Taking what it knew and scratching it onto something more durable than neurons. The bone outlasted the brain by 40 millennia.
Insight: The gap between “knowing” and “recording” is the foundational act of analytics. Every subsequent innovation — from cuneiform to cloud computing — is an iteration on this single move: getting knowledge out of one head and into a form that survives, travels, and scales.
II. When grain became data: Mesopotamia and the birth of structured records
Around 8,000 BCE, the agricultural revolution had occurred. Humans were no longer chasing livestock across savannas. They were settled. They had surplus grain, and surplus grain created a problem that tally marks alone could not solve: who owns what, and how much?
In Mesopotamia, the answer was clay tokens. Small, shaped objects — spheres for grain, cones for small measures — that represented quantities of specific goods. By 3,300 BCE, as scattered farming communities coalesced into Sumerian city-states, these tokens were sealed inside clay balls called bullae, stamped with personal seals to create tamper-proof transaction records.

Then came the insight that changed everything. Someone realized the impressions on the outside of the bulla were just as useful as the tokens sealed inside. The tokens became redundant. The signs evolved into cuneiform — angular marks pressed into wet clay with a reed stylus.

Writing was not invented to compose poetry or record myths. It was invented to do accounting.
The Sumerians developed a base-60 (sexagesimal) number system — the reason you still measure time in 60-second minutes and 60-minute hours, and angles in 360-degree circles. By the second millennium BCE, Babylonian scribes maintained sophisticated ledgers tracking harvests, debts, labor, and trade across dozens of city-states.
The data volumes were, by the standards of the era, staggering. A single temple archive could contain thousands of clay tablets. And with scale came a new problem that would echo across every subsequent era: how do you make sense of all of it?
Insight: Structured data is not a modern invention. The Sumerians had schemas (token shapes), records (tablets), archives (temple storage), and even a rudimentary concept of data integrity (sealed bullae). What they lacked was the ability to query at speed. That would take another 4,000 years.
III. The Venetian method: double-entry and the invention of financial truth
For most of recorded history, bookkeeping was single-entry: you wrote down what came in, what went out, and hoped the numbers balanced at the end. They frequently did not.
Then, in the merchant republics of 11th-century northern Italy — Florence, Genoa, Venice — a revolution quietly began. Trade was booming, fueled by the Crusades (1096–1291), which created explosive demand for Eastern silks, spices, and the European goods exchanged for them. Merchants operating at unprecedented scale found that bookkeeping methods adequate for a small shop collapsed entirely when applied to a trading empire.
The solution was bookkeeping alla veneziana — the Venetian method. Every transaction recorded twice: once as a debit, once as a credit. If the columns didn’t balance, something was wrong. The earliest known double-entry books are those of the Massari of Genoa, dating to 1340.
But the method did not spread widely until 1494, when the Franciscan friar and mathematician Luca Pacioli published Summa de Arithmetica, Geometria, Proportioni et Proportionalita — a 600-page textbook that included a 36-chapter treatise on bookkeeping titled De Computis et Scripturis (“Of Reckonings and Writings”). Pacioli’s genius was not invention but codification. He took a practice known to Venetian merchants and made it legible to the world.
The impact was seismic. Double-entry bookkeeping gave businesses a built-in error-detection mechanism. It made financial position visible and comparable. It enabled the growth of trade networks, joint-stock companies, and eventually modern capitalism itself. The essentials of the system have remained fundamentally unchanged for over 500 years.
Insight: Double-entry bookkeeping was humanity’s first data integrity protocol. It introduced a concept that would not be named for centuries but that underpins every modern data pipeline: reconciliation. If the numbers don’t balance, the story isn’t true. Pacioli’s real contribution wasn’t to accounting — it was to epistemology.
IV. Hollerith and the 63 million punch cards
By 1880, the United States had a serious data problem. The census — constitutionally mandated every 10 years to apportion congressional representatives — had taken eight full years to hand-tabulate. The population was 50 million and growing fast. At that rate, the 1890 census would not be finished before the 1900 census began.
Herman Hollerith, a 19-year-old Columbia School of Mines graduate working as a Census Bureau statistician, watched this slow-motion catastrophe unfold and decided to fix it.
Inspired by the way train conductors punched holes in tickets to encode passenger descriptions (“light hair, dark eyes, large nose”), Hollerith designed an electromechanical tabulating machine that read data via holes punched into cards. A wire passed through each hole into a cup of mercury below, completing an electrical circuit that triggered counters and sorting bins.
In 1888, the Census Bureau held a competition. Three contestants processed sample data from St. Louis. The first two captured the data in 144.5 hours and 100.5 hours. Hollerith finished in 72.5 hours. The tabulation phase was even more lopsided: competitors took 44.5 and 55.5 hours. Hollerith completed it in 5.5 hours — roughly ten times faster than his nearest rival.
He won the contract. For the 1890 census, 63 million Hollerith cards were fed through 43 tabulating machines. An experienced clerk could process 80 cards per minute. The job finished months ahead of schedule and $5 million under projected costs (roughly $170 million in today’s dollars). The census revealed a 25.5% population increase, tallying nearly 63 million Americans, and famously declared the western frontier officially closed.
Hollerith founded the Tabulating Machine Company in 1896. Through a series of mergers, it was renamed in 1924 to a name you might recognize: International Business Machines. IBM.
Insight: The Hollerith machine was the first time in history that data collection was faster than data processing. For 42,000 years — from the Lebombo bone to the 1880 census — the bottleneck had always been recording. Now, for the first time, the bottleneck shifted to what it would remain for the next century: interpretation. We could count faster than we could think.
V. The statistical century: from Nightingale’s roses to Fisher’s fields
The 19th and early 20th centuries belong to the statisticians — the people who figured out that data wasn’t just for counting things but for arguing things.
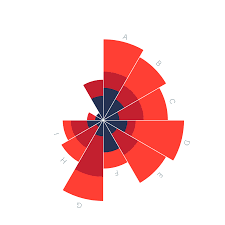
Florence Nightingale, returning from the Crimean War in 1856, did not just report that soldiers were dying of disease rather than combat wounds. She visualized it — creating her famous polar area diagrams (sometimes called “rose charts”) that made the data impossible to ignore. Deaths from preventable disease outnumbered battle deaths by a factor of ten. Parliament changed public health policy. The visualization, not the raw numbers, carried the argument.
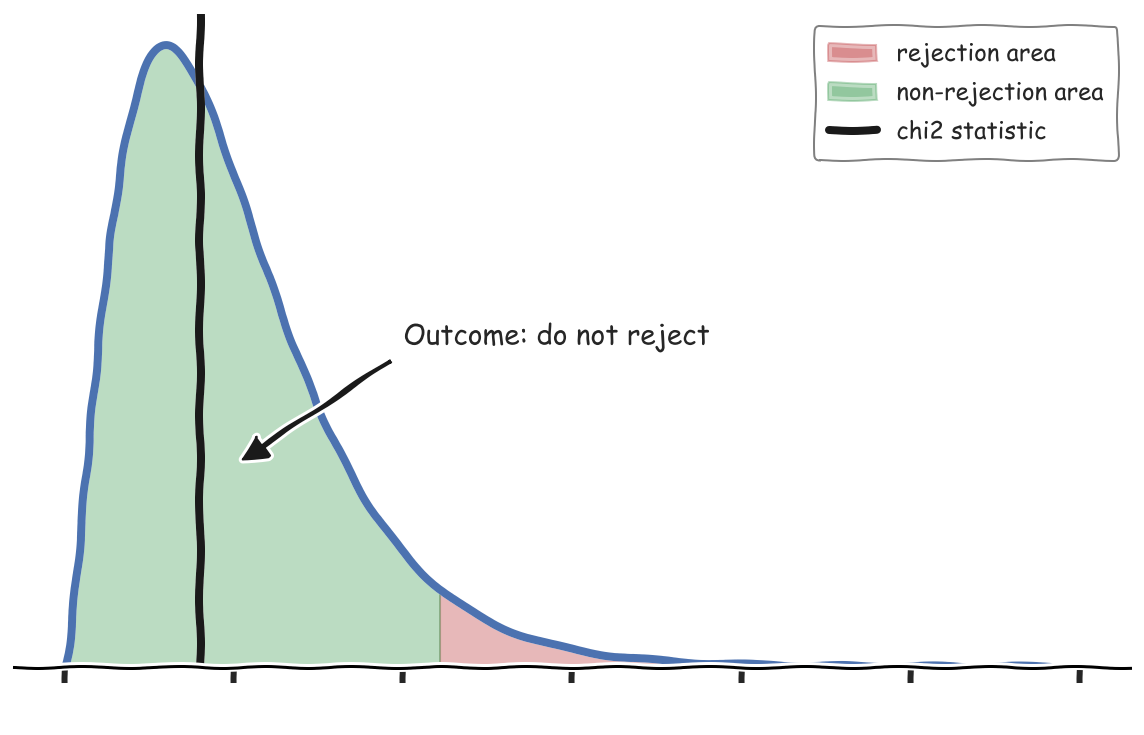
In 1900, Karl Pearson published “On the Criterion that a Given System of Deviations from the Probable in the Case of a Correlated System of Variables Is Such that It Can Be Reasonably Supposed to Have Arisen from Random Sampling” — a paper with a title longer than most modern Slack messages, but which gave us the chi-squared test and the foundation of hypothesis testing.
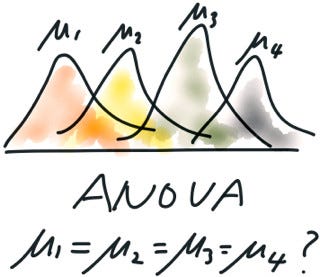
Ronald Fisher, working at Rothamsted Experimental Station in the 1920s, developed analysis of variance (ANOVA), maximum likelihood estimation, and the randomized controlled experiment — tools that would become the backbone of 20th-century science. His 1925 book Statistical Methods for Research Workers taught an entire generation of scientists to think probabilistically.
By mid-century, the intellectual infrastructure of modern analytics was in place: probability theory, hypothesis testing, regression, sampling, experimental design. What was missing was the ability to run these methods at scale without spending months on manual calculation.
Insight: The statistical revolution shifted analytics from counting to inferring. You no longer needed to observe every member of a population. You could sample, model, and extrapolate. This was the birth of analytics as a predictive discipline — the moment humans stopped asking “what happened?” and started asking “what will happen?”
VI. The digital switchover: 1950–2000
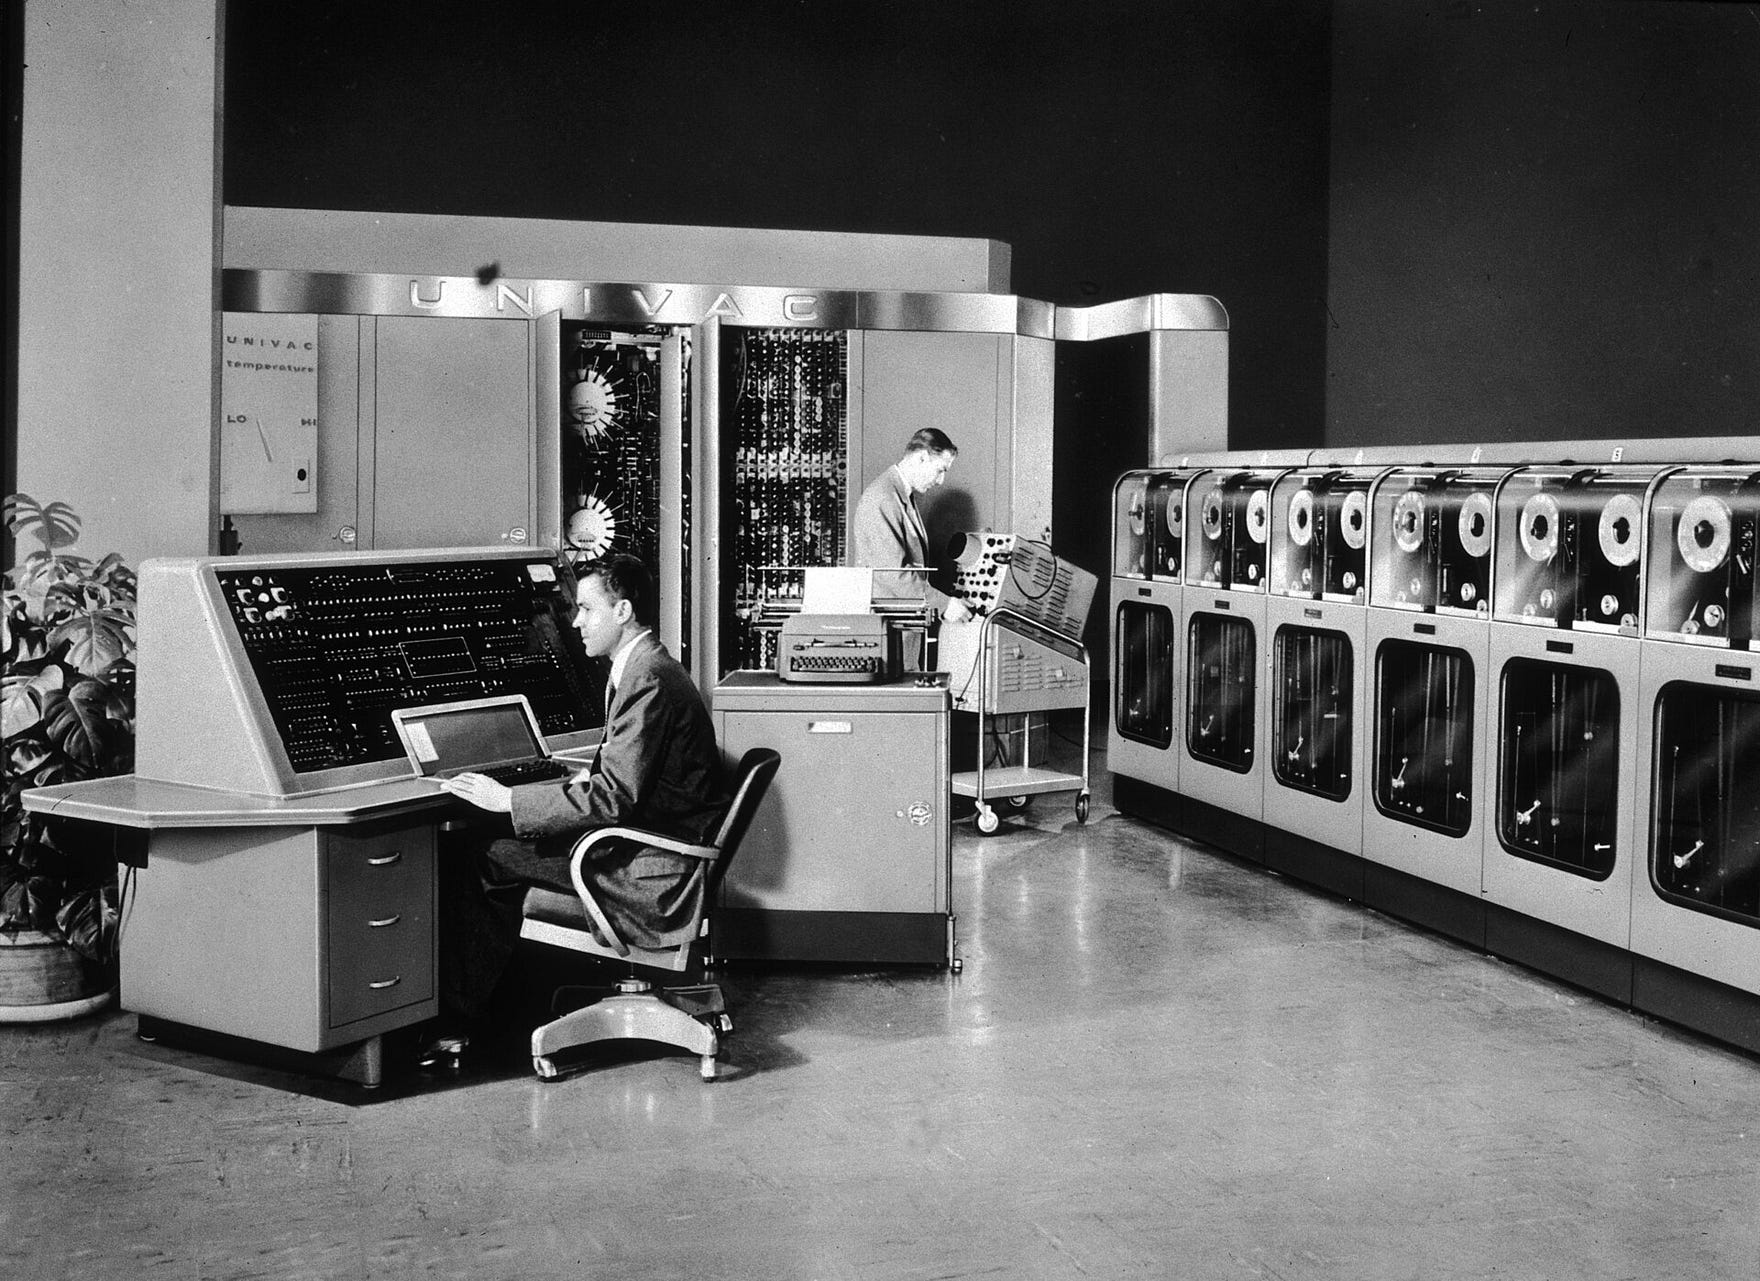
The UNIVAC I arrived at the Census Bureau in 1951, replacing Hollerith’s descendants after 60 years of mechanical tabulation. It could perform 1,000 calculations per second. It weighed 13 tons. UNIVAC stands for Universal Automatic Computer. They literally had to suffix Computer with Automatic.
What followed was a 50-year compression of capability that defies intuition. In 1965, Gordon Moore observed that the number of transistors on a microchip was doubling roughly every two years — a pattern that held for half a century and fueled exponential growth in computing power.
The milestones are familiar but worth grounding in numbers:
1970: Edgar F. Codd publishes “A Relational Model of Data for Large Shared Data Banks,” inventing the relational database. Every SQL query you have ever written descends from this paper.
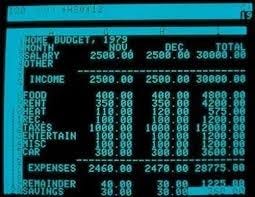
1979: VisiCalc launches on the Apple II — the first electronic spreadsheet. It sells 700,000 copies in six years and is widely credited as the application that justified personal computers for business. The first ever 2D representation of data, laying the foundation till date.
1985: Microsoft Excel ships. Today, an estimated 750 million to 1 billion people use it worldwide. It remains, for better or worse, the most widely deployed analytics tool in human history.
1988: Barry Devlin and Paul Murphy of IBM coin the term “data warehouse.”
1997: The term “business intelligence” enters mainstream use, though it was first used by Hans Peter Luhn at IBM in a 1958 paper. Gartner Group begins publishing its BI Magic Quadrant.
1999: “Big Data” enters the lexicon. At the time, it referred to datasets measured in gigabytes.
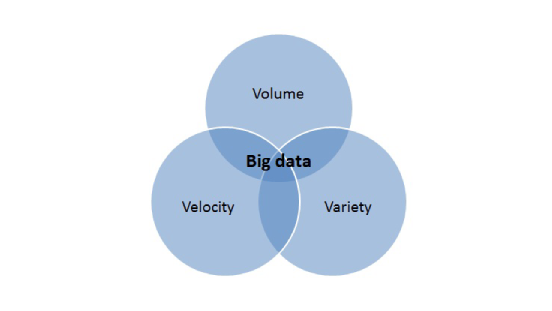
By the year 2000, the world had generated approximately 2 exabytes (2 million terabytes) of data annually. The tools to analyze it — SQL databases, spreadsheets, BI dashboards — were widespread but largely reactive. You asked a question. The tool returned an answer. The human did the thinking. Arising the beautiful 3 V problem of Big Data, Volume Velocity and Variety.
Insight: The digital era solved the speed problem but created the volume problem. Every efficiency gain in data processing led to an exponential increase in data generation. By the end of the 20th century, humanity was drowning in its own measurement — producing more data per day than the Sumerians created in a millennium.
VII. The dashboard era: beautiful, popular, and insufficient (2000–2020)
In 2003, a PhD student named Christian Chabot co-founded a company called Tableau Software, based on research from Stanford’s Graphics Lab on making databases visually explorable. It went public in 2013. Salesforce acquired it in 2019 for $15.7 billion.
Tableau, along with Power BI (Microsoft), Qlik, and Looker, defined the modern BI era. They democratized data visualization. Suddenly, a marketing analyst with no SQL training could drag and drop their way to a bar chart. Self-service BI adoption grew 31% year over year through the early 2020s.
The numbers are impressive. By 2025, over 78% of global enterprises had implemented at least one BI or analytics platform. The global BI market reached approximately $35–40 billion. Cloud-based BI solutions accounted for 65% of deployments, up from 46% just two years prior. Top platforms (Power BI, Tableau, Qlik, Looker) held a combined market share of roughly 74%. Executives using BI dashboards for daily decisions increased from 48% in 2023 to 67% in 2025 — progress, but still a third of leaders making gut-call decisions despite having the tools.
But the dashboard era produced a peculiar paradox: organizations were drowning in charts but starving for answers. Dashboards told you what happened. They were spectacularly bad at telling you why it happened, or what to do next.
The analytics workflow remained stubbornly manual. A business question would surface, wait in someone’s queue, get scoped, queried, visualized, interpreted, reviewed, presented, and — weeks later — acted upon. By the time the insight reached the decision-maker, the world had moved on.
Insight: The BI era’s greatest achievement was making data visible. Its greatest failure was mistaking visibility for understanding. A dashboard is a map, not a guide. It shows the terrain but doesn’t tell you where to go. The industry produced artifacts — reports, charts, slide decks — when what it needed to produce was answers.
VIII. The zettabyte flood: where we are now
Before we talk about where analytics is going, let’s ground ourselves in the scale of where it is.
In 2010, the total volume of data created, captured, copied, and consumed worldwide was approximately 2 zettabytes. A zettabyte is a trillion gigabytes. To store 2 zettabytes on Blu-Ray discs, you’d need a stack reaching the moon.
By 2023, that figure reached 120 zettabytes. By the end of 2025, projections put it at 181 zettabytes. By 2028, it is expected to hit 394 zettabytes. The datasphere is roughly doubling every four years.
Some context for these numbers:
- 90% of the world’s data was created in the prior two years. This has been true for the better part of a decade. It is a perpetually refreshing statement.
- IoT devices alone are projected to generate over 73 zettabytes in 2025, across an estimated 19 billion connected devices.
- Every connected person (roughly 75% of the global population) has approximately 4,900 digital interactions per day — one every 18 seconds.
- Nearly 30% of data generated is consumed in real time — never stored, just used and discarded.
- Approximately 90% of all data is unstructured — text, images, sensor readings, video — and does not fit neatly into the rows and columns that SQL was designed for.
- Over 97% of businesses have invested in big data to some extent, but only about a quarter report meaningful profit attributable to those investments.
The data analytics market itself was valued at roughly $51.55 billion in 2023 and is projected to reach $279 billion by 2030. Global spending on AI technologies is on track to exceed $337 billion by 2025.
This is the environment into which every new analytics tool, framework, and philosophy is born. Not a scarcity of data. A terrifying abundance of it. And a persistent, widening gap between the data we generate and the decisions we make from it.
Insight: We have crossed a threshold. Humanity now produces more data per second — approximately 3.81 petabytes — than existed in total when the term “Big Data” was coined. The constraint is no longer storage, compute, or visualization. It is cognition. The human analyst is the bottleneck. And that is exactly the problem that the agentic turn is trying to solve.
IX. The agentic horizon: from data as a tool to data as an agent
Then came ChatGPT.
For 42,000 years, the relationship between humans and their data followed a consistent pattern:
Human asks → System retrieves → Human interprets → Human decides.
The tools improved. The bones became clay tablets, then ledgers, then punch cards, then databases, then dashboards. But the loop stayed the same. The human was always the initiator, the interpreter, and the decision-maker. Data was a tool — a powerful one, but inert until a human picked it up and wielded it.
The agentic shift, which accelerated dramatically through 2024 and 2025, breaks this loop.
An “agent,” in the AI context, is a system that can perceive its environment, form plans, take actions, and learn from the results — with varying degrees of human oversight. Applied to analytics, this means systems that don’t just answer questions but anticipate them. Systems that don’t just query data but navigate it — choosing which tables to join, which metrics to compute, which anomalies to flag, which stakeholders to notify — without waiting to be asked.
The shift can be described in three phases:
Phase 1 — Copilot (2023–2024): AI assists the analyst. Natural language interfaces let analysts describe what they want in plain English; the system generates SQL, code, or visualizations. The human still drives. The AI suggests. This is the equivalent of power steering — you still turn the wheel, but the effort is dramatically reduced.
Phase 2 — Sidekick (2024–2025): AI shares cognitive load with the analyst. It remembers prior analyses, understands business context, connects insights across sessions, and proactively surfaces observations the analyst hasn’t asked for. The human is still the hero. But the AI is a thinking partner, not just a tool.
Phase 3 — Autonomous Agent (2025–onward): AI operates within defined boundaries, executing end-to-end analytical workflows. An executive asks a question. The agent retrieves the data, runs the analysis, generates the narrative, delivers it in the executive’s preferred channel, handles follow-up questions, and only escalates to the human analyst when the question exceeds its scope.
OpenAI quietly validated this trajectory in early 2025 when it published a detailed account of building an internal data agent — a system architecturally indistinguishable from the sidekick model described above. The big players have noticed. But they are building general-purpose agents. Analytics, with its messy enterprise data, undefined solution spaces, and subjective deliverables, requires specialized harness.
This is the critical nuance. Code has tests. Software has specifications. An API call either works or it doesn’t. Analytics has none of these clean boundaries. A “good” analysis is partly technical, partly narrative, partly political. It depends on context that lives in the analyst’s head, the organization’s culture, and the executive’s unstated preferences.
General-purpose AI can generate a chart. It cannot, without deep contextual training, generate the right chart for this audience at this moment in this organization’s decision cycle.
Insight: The agentic horizon is not about replacing analysts. It is about externalizing the last thing that was still trapped inside human skulls: context. Memory was externalized 42,000 years ago on a baboon bone. Arithmetic was externalized in 1890 on a Hollerith machine. Statistical reasoning was externalized in 1951 on UNIVAC. Now, analytical judgment — the ability to decide what question to ask, which data to trust, and how to frame the answer — is being externalized into agents that learn, remember, and act.
X. The memory problem
Every AI lab is building better models. Necessary, not sufficient. Analytics resisted automation because it is deeply contextual — two companies on the same schema need different analyses because their KPIs, politics, and definitions of “success” differ. That context lives in scattered docs and the analyst’s head. Neither scales. Neither survives turnover. The next breakthrough isn’t a better model. It’s better memory.
What the caveman and the agent have in common
The Lebombo bone tracked 29 data points. The modern datasphere generates 181 zettabytes per year. Forty-two thousand years apart. The impulse is identical.
A human has a question. The question matters — survival, trade, profit, truth. The human externalizes evidence onto something more durable than neurons. Then the human uses that evidence to be less wrong.
The technology changes. The cognitive architecture doesn’t. We externalize memory. We automate reason. We build tools that extend the reach of human judgment — not to replace it, but to free it for the problems that truly require it.
The agentic turn is not the end of this story. It is the latest chapter. And if history is any guide, the next bottleneck is already forming — invisible, inevitable, and waiting for someone to carve the first notch.
Analytics has always been a human story. The tools just keep getting better at telling it.
Future of Analytics is a weekly series by Friday Intellytics. We help data teams deliver faster insights with AI. Subscribe to get each issue delivered to your inbox.
Subscribe on Substack →